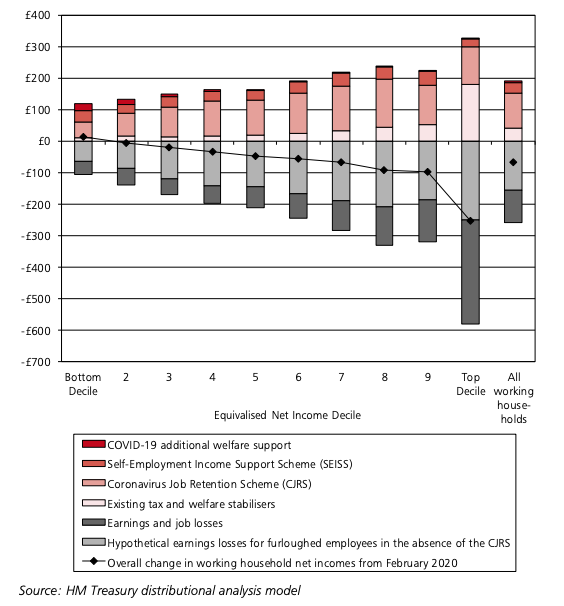
A new report published by the government examines the impact of government support when set against the effect of earnings and job losses due to the pandemic.
The data examined covered the periods from February 2020 to May 2020 to see the economic effects on working households. It includes a monthly payment representation of the government support furlough scheme and self-employment income support scheme. The data also included the changes to Universal Credit and Working Tax Credits.
The data showed:
- Compared to pre-pandemic income, the poorest households were the most supported by government income support schemes.
- On average a fifth of income for working households has been through government schemes.
- Intervention by the government has reduced potential losses for working households by up to 66 percent.
Below is a table of the median annual incomes based on their income percentile within the working household population.
| Percentile | 1 adult | 1 adult + 1 child | 2 adults | 2 adults + 1 childs | 2 adults + 2 children |
|---|---|---|---|---|---|
| 90-100% | 80,200 | - | 111,200 | 150,000 | 179,500 |
| 80-90% | 52,500 | - | 75,200 | 97,800 | 119,200 |
| 70-80% | 43,400 | - | 61,500 | 77,000 | 97,500 |
| 60-70% | 37,200 | 43,900 | 52,300 | 67,900 | 83,600 |
| 50-60% | 32,600 | 42,200 | 45,500 | 57,700 | 71,200 |
| 40-50% | 27,700 | 34,900 | 39,600 | 52,400 | 61,100 |
| 30-40% | 23,900 | 29,600 | 34,300 | 43,700 | 52,000 |
| 20-30% | 19,800 | 23,600 | 29,700 | 36,100 | 45,100 |
| 10-20% | 16,800 | 21,200 | 23,800 | 30,100 | 35,000 |
| 0-10% | 11,500 | 16,200 | 17,500 | 23,200 | 26,600 |
Based on the percentiles above, the chart below shows how working household incomes have changed when compared February 2020 with May 2020.

You can calculate your income percentile by using our individual pre-tax and post-tax income percentile calculator.


